I hit a problem calculating requests per minute from a log message. I couldn’t find any information on how to do this; most people favour open telemetry. I find a lot of the time; this is overkill for what is required. Especially given the amount you have to litter your codebase with open telemetry spans and traces.
We have a structured log line as follows:
 {
    "level": "info",
    "key": "response",
    "duration": 41.732642,
}
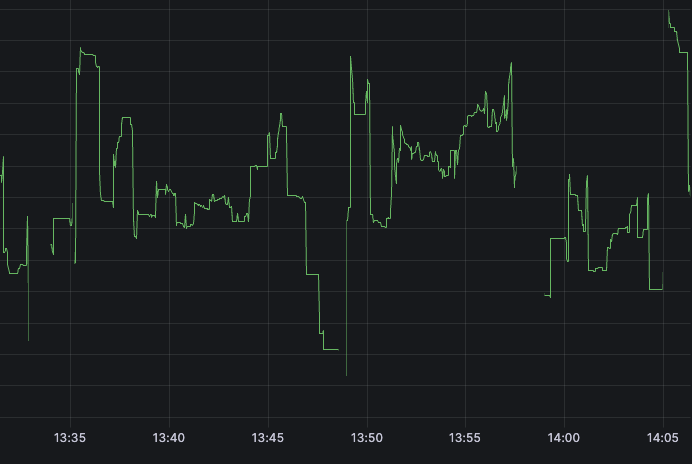
Graphing the response time was easy. We need to extract the duration from the line using line_format.
{app="my-app"} | json | key = "response" | line_format "{{.duration}}"
We can this plot that onto a graph with no problem.
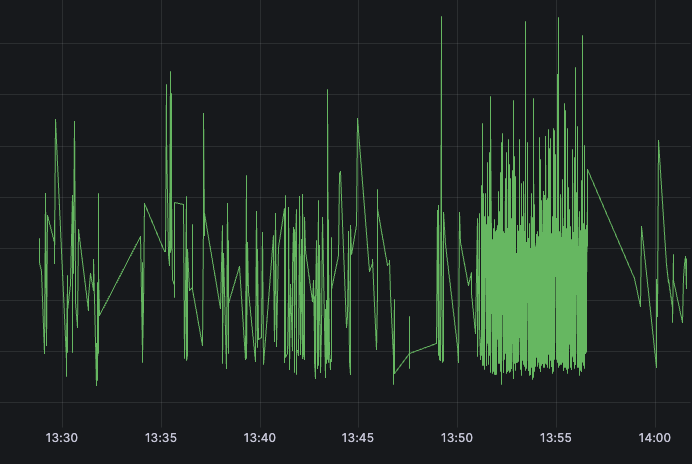
For p99 it’s a little more tricky; we need to utilise quantile_over_time. The difficulty is that you must unwrap the duration rather than using line_format.
quantile_over_time(0.99, {app="my-app"} | json | key = "response" | unwrap duration [1m]) by (app)
Notice here we are using a [1m]` as our unwrapped range parameter.
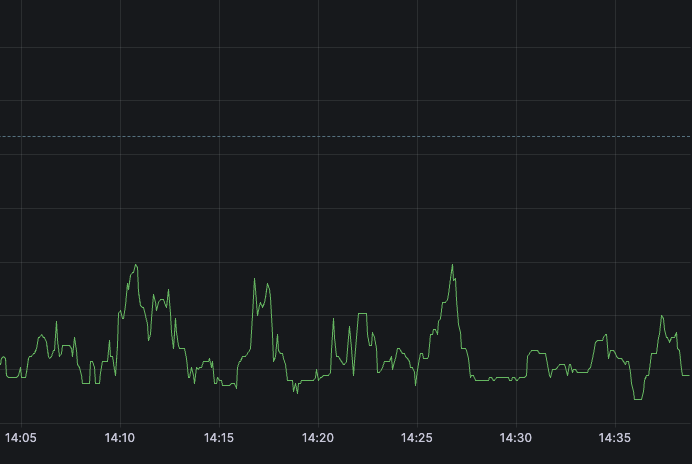
For requests per minute, I utilise count_over_time, which converts your log entry into a number; unsurprisingly, this is a count of your logs! Then, we want to sum them every minute.
sum(count_over_time({ app="my-app"} | json | key="request" | [1m]))